


How to cut fleet incidents in 30 days: from causes to a pilot
Direct and indirect business costs from road crashes and incidents include repairs, downtime, vehicle replacement, administrative time, higher insurance premiums, and disputes with partners and insurers.
ADASSYSTEMSSYSTEMSADASVIDEO TELEMATICSAI-POWERED ANALYTICSAI-DRIVEN FATIGUE
8/31/20253 min read

Direct and indirect business costs from road crashes and incidents include repairs, downtime, vehicle replacement, administrative time, higher insurance premiums, and disputes with partners and insurers.
At the national level, total losses are estimated at around 2% of GDP (with a country range of 0.4–4.1%).
Road_Safety_Thematic_Report_Consequences_of_crashes_2023.pdf
1. The problem: what actually causes crashes (research-based)
Speed — a factor in roughly ~30% of fatal crashes. A 1 km/h drop in average speed reduces risk and severity; –10 km/h can deliver up to ~50% fewer fatalities (power model).
Alcohol/drugs — involved in about ~25% of fatal crashes in Europe.
Distraction (phone/attention) — features in ~5–25% of crashes (often under-reported in police records).
Seatbelt non-use — linked to ~25% of fatal outcomes.
Fatigue, rule violations, infrastructure — significant co-factors that amplify overall risk.
Table 9: Cost per casualty by severity for GB (£) at 2022 prices | Transport Scotland
2. Business impact (money, SLAs, insurance)
What’s in the cost? Repairs, downtime and replacement vehicles, admin time, higher insurance premiums, disputes with partners/insurers. Across countries, the total cost of crashes is about ~2% of GDP (range 0.4–4.1%).
Quick money benchmark for a “typical” fleet
Official Western Europe valuations give practical unit costs:
Property-damage-only collision: ~€3.300
Minor injury (business-relevant share): ~€12.000
Difference between injury and damage-only: ≈ €8.700
Collision frequency benchmarks
~4.55 collisions per 1 million miles (CPMM) of exposure.
~12 collisions per 100 vehicles/year in survey data.
Example — 50-vehicle fleet
Annual run: 60,000 km/vehicle ⇒ 3,000,000 km/year total.
Expected collisions (CPMM): 1.86 × 4.55 / 1,000,000 ≈ 8.5 per year.
If all are damage-only: 8.5 × €3.300 ≈ €28.000 /year direct cost.
If 10–20% involve injury elements: extra ≈ €7.400–14.800,
Total guide: € 35.000 – 43.000 /year (not counting downtime and premium increases).
Mini-formula for your page
Annual loss ≈ (collisions × €3.300) + (injury collisions × €8.700) + premium/downtime.
Compare these guides with your mileage and actual incidents — you’ll see how much money is “left on the road”.
3. What works in practice (from many fleets)
The Cost of Doing Nothing
Higher crash rates
Increased insurance costs
Unexpected fleet downtime
Legal risks including multi-million-eur lawsuits
Increased driver turnover due to unsafe working conditions
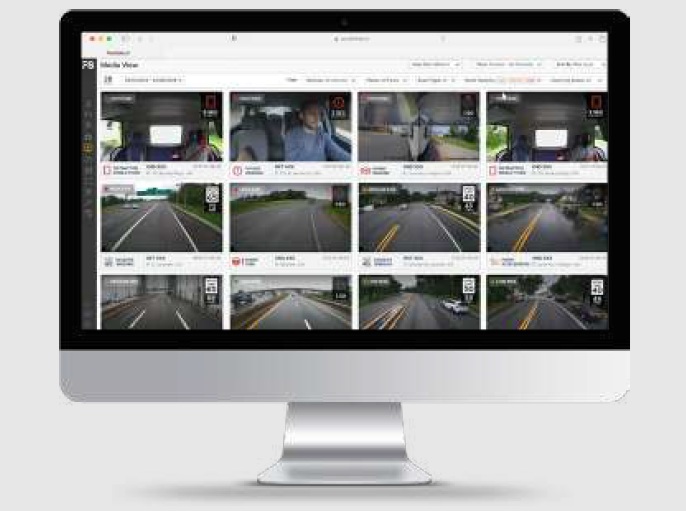
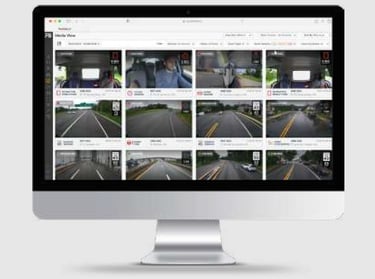
A. Event-based video + real-time in-cab prompts
No always-on streaming. The camera saves a short clip on a risk event (phone, distraction, tailgating, seatbelt, speeding). The driver gets a prompt immediately; the manager gets a clip with context (speed/location). That’s both training and claims evidence.
B. Short weekly coaching (20–30 min)
Review 5–7 clips using “2 kudos, 2 improvements”. Positive reinforcement increases driver buy-in.
Why it works (evidence, vendor-agnostic)
In peer-reviewed trials with commercial drivers, the best results come from instant feedback + regular coaching: the adjusted odds of risky behavior drop to 0.52 vs control (versus 0.86 for “indicator-only” without coaching).
Micro-case (anonymised, real reporting format)
“Distribution fleet, 55 vehicles. In 30 days: –28% near-miss, 2 exonerations, €7.900 saved (repairs/downtime). Settings: event-only, 1 coaching session per week.”
4. A 30-day pilot (3–5 vehicles)
Week 1 — Focus & start
Pick 2–3 pain points (distraction/phone, following distance, seatbelt, speed), set baseline KPIs. Install cameras (< 60 min/vehicle). Default event-only; live video on request.
Weeks 2–3 — Coaching rhythm
Weekly, short sessions: 5–7 clips, “2 kudos, 2 improvements”. In-cab prompts run continuously.
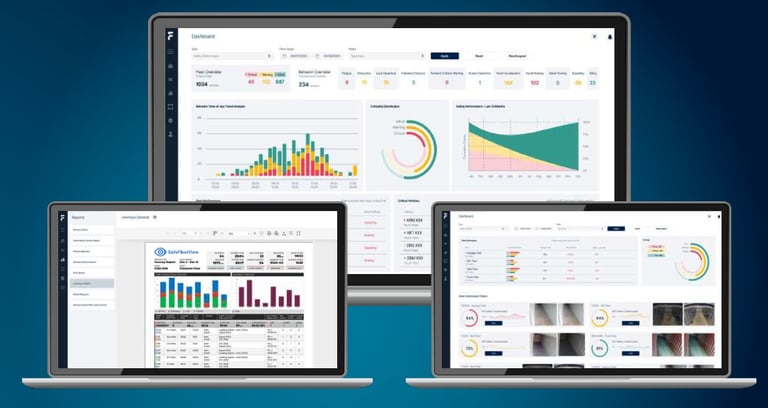
Week 4 — Results & plan
One-pager + slide deck: before/after KPIs, 3 exemplar clips, savings estimate (repairs/downtime/insurance), scale-up plan.
CTA:
Start a 30-day pilot on 3–5 vehicles — see results in facts, without a heavy platform rollout.
AI-Powered Video Telematics for Safer, Smarter Fleets. Boost safety, reduce costs, and meet EU GSR compliance
Contact us
sales@ecotelematics.com
sales@safefleetview.eu
Finland, Turku +358 405189190
© 2026. All rights reserved.
Latvia, Riga +371 29125630
Lithuania, Palanga +370 63392200
Estonia, Tartu +372 5398 0890